Used EV Payback (Part 2, Was it worth it?)
TL/DR Summary
How much to you save buying a used EV, and is it worth it? How long is the payback? Do you want to compare to my original estimates? This is my actual calculations about four years later and close to 100,000km on the odometer of the 2014 Nissan Leaf I purchased. Cutting to the chase, it was a LOT better than my estimates, and I wish we’d bought two of them.
Also below, I compare what payback would have been like if New Zealand had road user charges in place for EVs (…longer obviously, but not hugely so) and how much I cost the taxpayer in controversial FREE PUBLIC CHARGING (spoiler alert… not much).
Note that adding a vehicle sale in to the payback calculation mix is ONLY useful if you have an older car, and were not planning to spend the extra premium to jump to EV ownership (a common situation, and one who this article is aimed at).
If you are selling a car that is close to the value of (or more expensive than) the EV – you are already rich enough – so there is obviously no point in considering this in the return period. You can though add the other car’s fuel figures and still get a useful payback period from the spreadsheet (based on efficiency only) in comparison.
Here is a link to the ‘Actuals’ spreadsheet I used with the values below.
NOTE: the values I have in this article may differ slightly from what these sheets say – I’m continually tweaking the sheet and calculations.
zorruno_nissan_leaf_payback_calcs_actual-june-2022.xlsx
Downloadable Microsoft Excel document
zorruno_nissan_leaf_payback_calcs_actual-june-2022
Link to Editable Google Sheet
Summary
So, after working out previously that I should at least get a 5 year payback, I bought a second hand EV, and a year or two later sold our Mazda Demio. This was back in September 2018. What’s changed between then and now (June 2022) and how is the payback going? I should have plenty of real world data now to check, and I’ve included my data and how I came up with the numbers below.
EV purchase
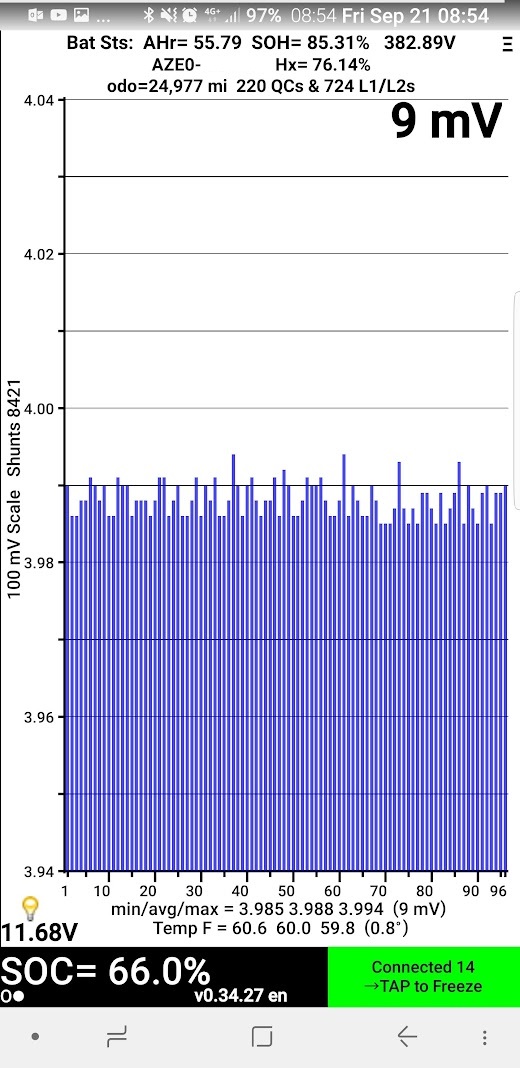
September 2018 I looked around and found a private sale of a 2014 black, Nissan Leaf S. (I only buy black cars). I had learned enough already to check the SoH and had an ODBII dongle at the ready. It was still on 12 bars (just… 85.1% SoH) which was a bonus. Also just 24kkm on the clock with again was great, but I also knew enough that the km driven were far less important than battery health.
After some rapid negotiation (I didn’t even take it for a test drive…) I got it for NZ$14k, which I have been told that even then was a great buy (now… even older EVs seem to be a lot more money for a decent SoH). It had a decent aftermarket stereo, but the dash was still in Japanese. $100 and 10 mins (thanks to Yuri at hybrids.co.nz) was all it took to fix that a few weeks later (I’ve included that in my buy price).
I originally allowed NZ$16k in my estimate calcs, A 2014 Leaf for just NZ$14,100 in 2018 means there is already some upside in my initial estimates.
Petrol Car Sale
It took a fair bit of time to sell one of the other cars as it took a while to convince ourselves that we should, and if we would cope without it (range anxiety takes a while to get over!). Maybe a year or two later we sold it, at a time when we needed cash for house renovations. Timing was perfect though as we actually sold our Mazda Demio for a bit more than we paid for it a few years earlier (purchased in 2017), which is almost unheard of.
Of course it was a great car and we had looked after it, I had also installed a decent aftermarket stereo with reversing camera in it (one I already had) so someone still got a great buy. We sold the Demio for NZ$7,200, and I had only allowed NZ$6,500 in the initial calcs, so more upside there.
Petrol Costs
(this is in the second tab of the actuals spreadsheet as a reference)
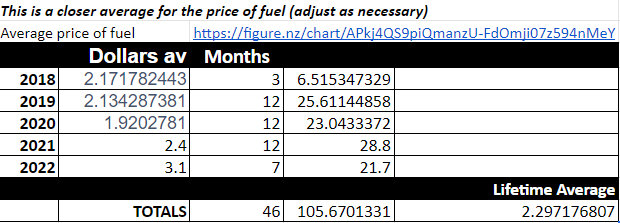
I now could more closely estimate fuel costs over the years. I didn’t look up local fuel price every time I charged the EV (I’m not that dedicated sorry), but I found some more data about yearly costs of fuel in NZ over the 46 months of ownership and took an average (it may even be more in Auckland).
Fuel prices are ridiculous now (well over NZ$3) but over the course of the preceding 46 months it worked out to be less (eg 2020 average was only NZ$1.90/L) so the average over ownership is around NZ$2.30/Litre. This is coincidentally exactly what I had estimated. Obviously if I was redoing an estimate now, fuel cost would be much higher.
Kilometres driven per day
This made a decent impact too, although, I’m surprised it did. Once we bought the EV and both got used to the driving range, we tended to use it wherever possible and for as long a distance as we could. We never did do any long, multi-stop trips, but plenty of driving to near max range, or to destination chargers when we felt comfortable doing so.
COVID and lock-downs has taken a big chunk out of this, so although the car is creeping close to 100kkm on the odometer, it should really be a lot more now. For close to two years, I drove to the city office on average about once per fortnight. The things that really added km to the clock were a bunch of trips over the last year to renovate our rental property (approx 50km away), trips to the other side of Auckland to visit family, and activities like weekend dropoffs for kids sports, jobs etc around greater Auckland.
The odometer doesn’t lie though, the km figure at least is 100% accurate at 73,023km driven. This works out over the lifetime to be 53km per day, and I had estimated less at 45km/day over a full year.
Electricity Costs
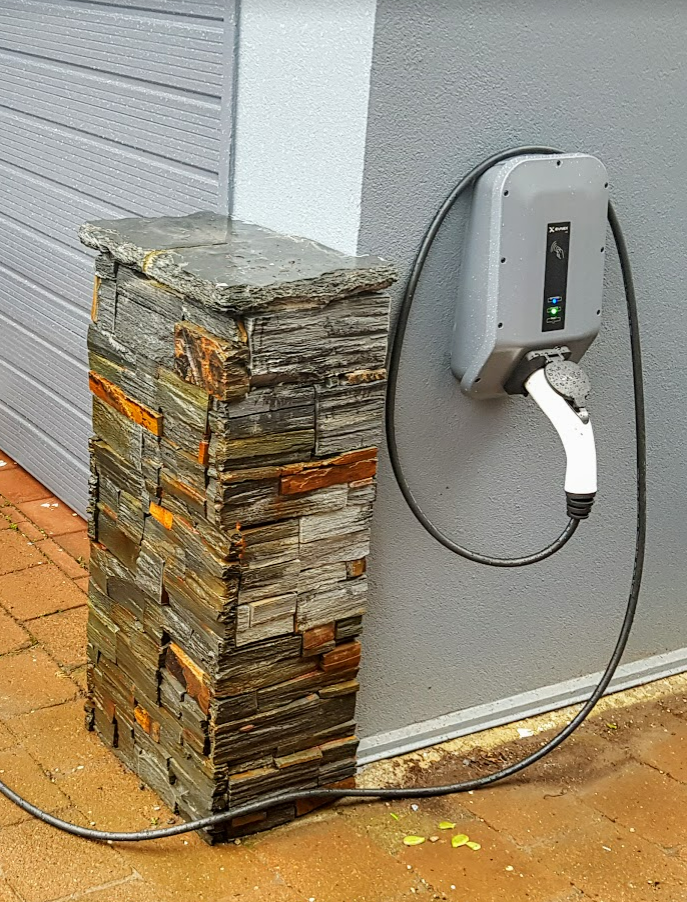
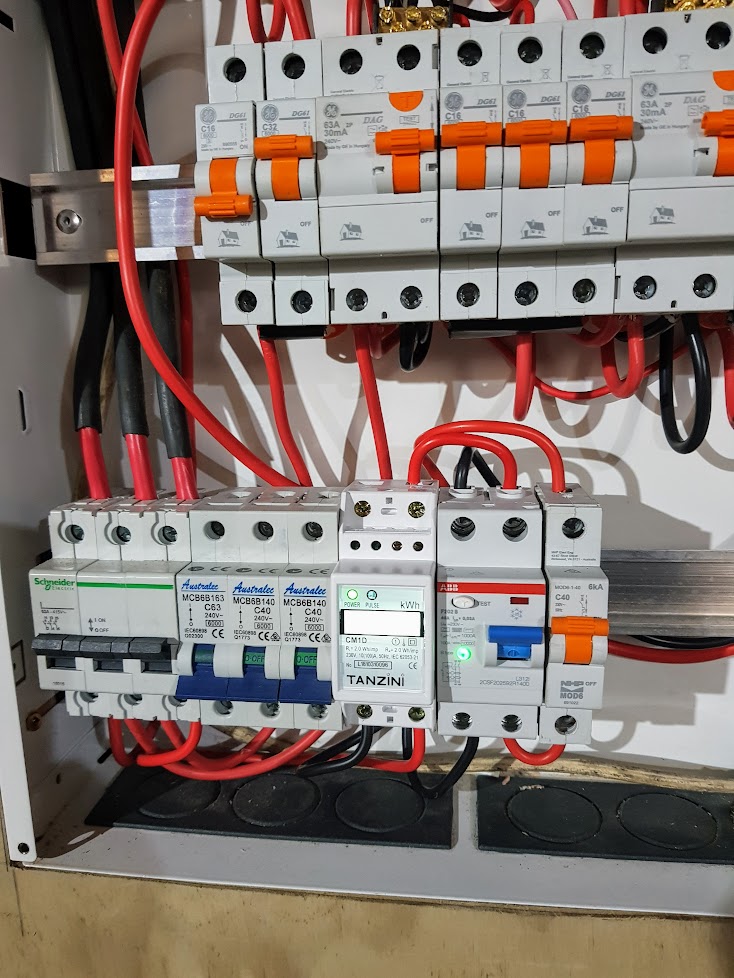
This is where it gets interesting. Being the geek I am, I have a pretty extensive home automation & monitoring system. About 15 months ago I wrote some monitoring code for the EV charging at home that calculated every kWH put in, and the cost to do so. I’ve changed power plans a couple of times in the last 3 years (Contact Energy, Mercury and back to Contact), specifically to make use of their night rates. Currently, we have a Contact Energy plan that give us absolutely free power from 9pm to midnight (and the charging is automated to utilise this as much as possible) My code takes care of these peak/offpeak cost splits.
Many people tout that EVs add unnecessary stress to the local power grid. This is complete bollocks. My data shows that almost ALL our charging is offpeak (as it will for most people), and actually we have a wallcharger that is controlled (over the internet) by Vector. They ramp delivery up and down as they decide (similar in a way to the old ripple control for hot water). I’d love some solar, but unfortunately we won’t be at this house long enough to give a sensible payback. It is also great though that 80% of the power (and rising) in NZ is produced from renewable sources.
So how much did I use? My power monitoring was every day for 440 days. The average cost of power over those days was almost exactly $1. Yes, just a dollar. Many of those days were completely free (charging between 9pm and midnight) so that sounds about right.
Below is a link to a spreadsheet file of my electricity data.
It is a complete picture of my energy use (EV charger only) and cost (peak/offpeak adjusted) over the last 440 days. The file originally uses JSON & csv formatting but I’ve removed some formatting for the summations.
Zorruno_EVCharger_poweruse_2022_440_days
Link to Google Sheet
Are these calculations the whole picture for $/kWH for the full vehicle lifetime? No, but they get me much closer.
Here are some things I needed to adjust for:
- More realistically, the earlier days of ownership wouldn’t have been that good as we had no completely free power. Still, over it’s lifetime I had either a free hour of power, and/or offpeak rates. I’ll need to adjust it upwards because of this.
- A few times in the last few years some friends have used my EV charging point. Not a lot, and I didn’t record when, so I’ll ignore these in my calcs as it won’t make a huge difference.
- Line & other charges on the power bills were taken into account as much as possible in the software I put together. In reality, fixed charges are part of a power bill no matter how much electricity you use.
- Some home charging was definitely at peak times when we needed it. Cost is accounted for in my more recent monitoring though (it can be seen on some of the summary lines), so on average would be for the previous years. Power prices have also increased over time.
- Additional “Paid for” charging? I always envisaged I’d go to the chargenet stations, and pay for some topup. I even have a chargenet tag. Actually, I never needed to. Have been close at times, and wouldn’t hesitate to if needed to… but didn’t, so nothing is included.
- That brings me to “Free Charging”. I am truly grateful for Vector, Counties Power, Kiwi Properties, Auckland domestic airport and other shopping centres etc for their free Level 1 and 2 charging. I even charged at friends’ places a few times when visiting which was nice. (I wish my work would install some in their carpark, but sadly no).
A NOTE ABOUT FREE CHARGING: With free charging comes responsibility. I have never abused the free public charging privilege. I charge to 80% (or less) if others are waiting and often buy something from the service station or shopping centre location. Also, I only ever used the Level 1 fast chargers chargers if I absolutely needed them to top up quickly to get somewhere. Most charging was at home, overnight, with offpeak power. Access to free charging has probably made a difference, but not a huge amount.
See my calculations later that show just how much free public charging I have used.
So after all of this, lets do something conservatively wild and say multiply the recent average cost of charging the Leaf by 150%, i.e. $1.50
Working backwards in the spreadsheet (I use the goal seek function), I put $1.50 as the per day cost and this spits out an average lifetime efficiency value of 2.8c/km.
Other Costs
What else changed from the original estimate? Well I’m pretty sure I overestimated the maintenance costs. Really, I’m only just looking at new tyres now, and have replaced wiper blades once. I put this EV maintenance cost down to $100 per year. Again, there have been no RUCs, so they are still set at zero.
Final Estimate
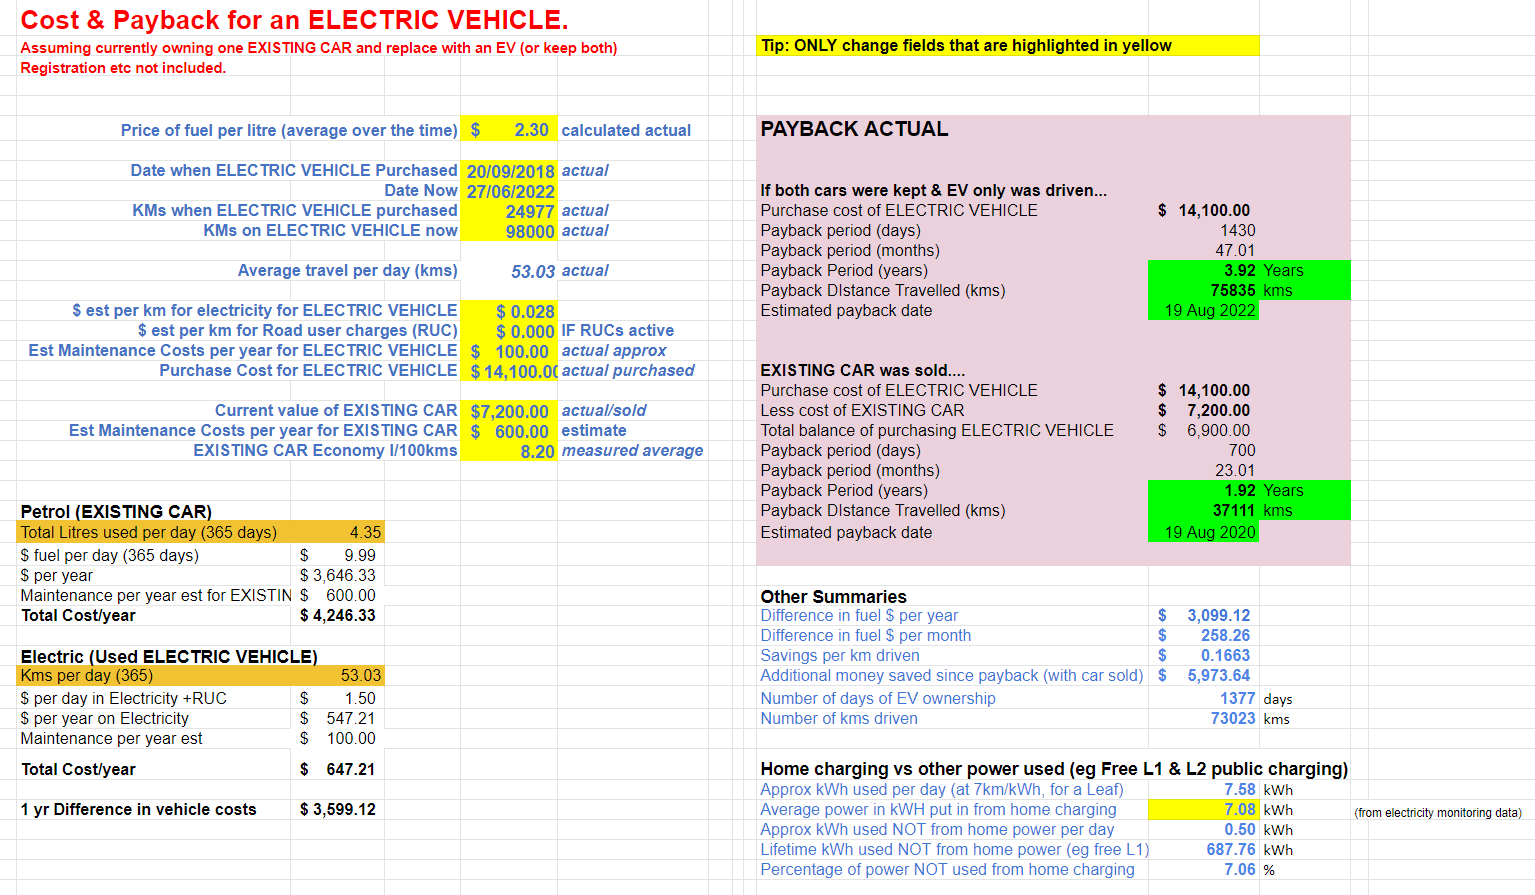
So that should be everything. The Demio was sold, an EV was bought and I have much more accurate values for other costs. The answer? Check out the spreadsheet. Payback in 700 days, or 1.92 years… way back in September 2020. We could have kept the other car and still got less than a 4 year payback.
Conclusion:
Payback in Under 2 Years
at 37,000km driven
That is pretty impressive – especially as due to COVID this could be better, and petrol prices keep going up. So do Nissan Leaf and other second hand EV prices unfortunately. There are other places I could have been more conservative in my actuals too.
What Else?
RUC Impact?
What happened if we included RUCs? Many people say the addition of Road User Charges will be a problem for EV ownership and payback. Well of course it does extend the payback time, but it is still good. If we put an RUC figure of 7.5c/km in (which is the amount that Diesel users pay) this pushes the payback time to just over 3.2 years and 62,000km (Do this calculation yourself if you like for your own use case).
Don’t plan to sell a car?
What if you already have a nice car, or don’t have a car you are willing to sell, but still plan to get a used EV? As mentioned above, my calculations were mainly around ONE common scenario – i.e. people have an older car and want to know paying a lot more for an used EV is a sensible thing to do. If you have a more expensive car, or a car that you will sell that is similar value to the EV purchase… obviously DON’T include the sales price in the spreadsheet. If you plan to drive the EV in place of it most of the time then just include it’s fuel use figures… not the sell price (and look at the top section of the payback calculations only).
So… what if I didn’t sell any cars in MY calculation? Well my spreadsheet included shows this. No cars sold, still gives me under a 4 year payback at around 77,000km driven (and for me, this should be August this year). This is not going to be exact of course, as there are lots of other things to consider like added registration fees, regular maintenance still on the existing car.
Additional profit?
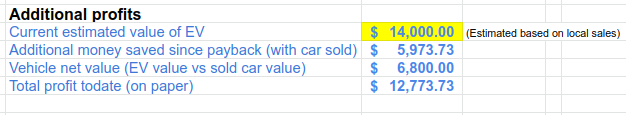
How much have we gained since the full payback date? Well, the calculations show that we have pocketed close to an extra $6,000 in savings since that date. That is not even including the current value of the EV (which is at 10 bars now). What is even more strange is that there are Nissan Leafs of this age selling for at least what I bought it for in 2018 (and more). This is understandable, but weirdly this means now that this car (if I sold it for $14K) would have netted me $6,800 (Leaf sale price, minus the value of the car I sold) plus extra savings has made us at least around $12,800 (…well on paper anyway).
All because of Free Public Charging?
I often hear “This only works because of all your free public charging in Auckland” Is this true? Am I a burden on the average taxpayer because of my electricity frugality? Well we can work this out too. We know the efficiency of the Leaf, I have records of the last 440 days of power put in from home, and we know how many km have been driven.
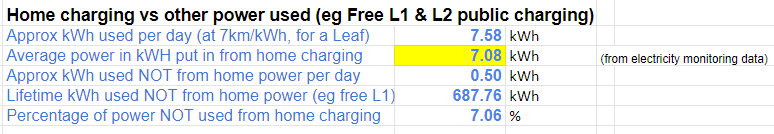
The actual amount of charge used over 440 days was 7077kWh per day (from my electricity data spreadsheet). Over the ownership period, and due to the leaf’s reported efficiency of 7km/kWh we should be using, so that tells us the leaf needed around 7.58kWh per day. Where did imbalance come from? It must be from the public charging stations. That’s an imbalance of 688kWh over the lifetime or 7% of the total car charging. Wow, how much have I saved from “Free Public Charging”? At say a high end of 35c/kWh (chargenet charges 25c, plus a per minute time), I’ve saved a massive $240 through free public charging.
Thanks, and Errors/Corrections
Well, that is about all for the calculations. I encourage you to use the spreadsheets for your own purposes and see what payback periods you can come up with for your car. Newer EVs are obviously a lot more expensive, so a payback period will likely be less relevant to those owners.
Also, I’m not a statistician, so if you are, (or you play one on TV) and you find I have stuffed up somewhere, please let me know. I plan to keep the spreadsheets up to date and maybe tidy them up a bit more over time so if you think of other summaries that could be useful, I am happy to include them.